
debugging · folio
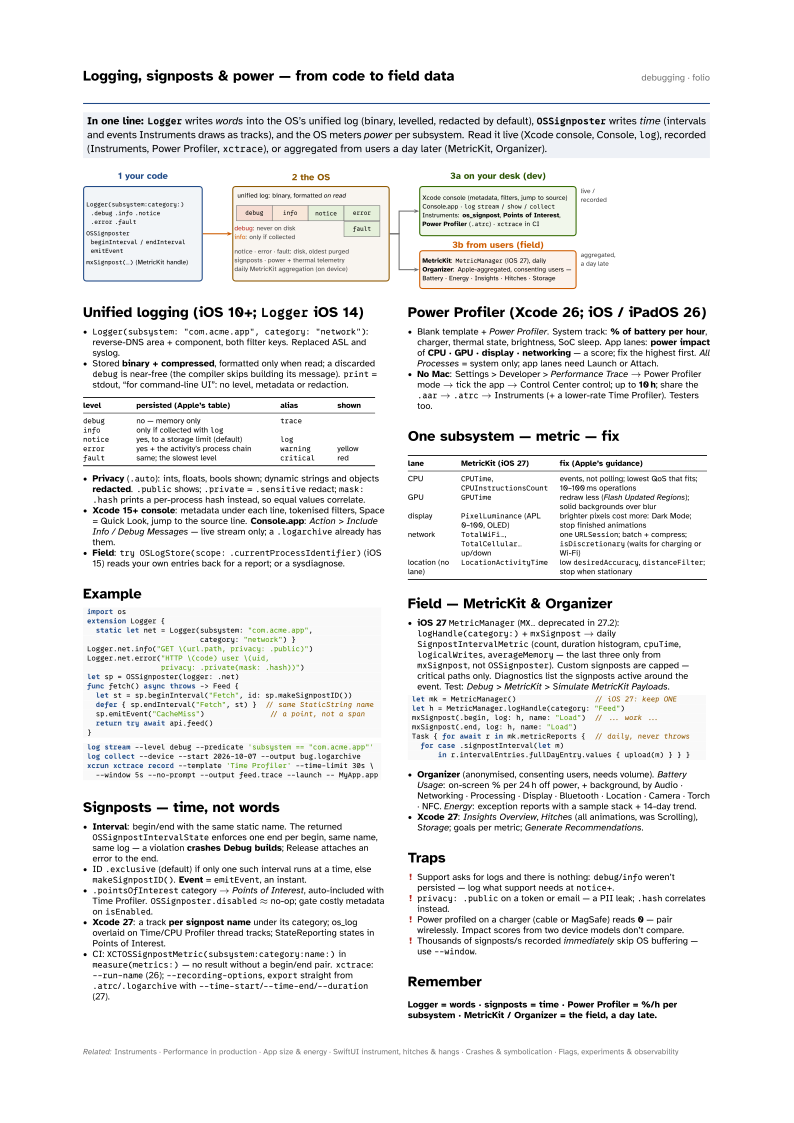
In one line: Logger writes words into the OS’s unified log
(binary, levelled, redacted by default), OSSignposter writes
time (intervals and events Instruments draws as tracks), and the OS meters
power per subsystem. Read it live (Xcode console, Console, log),
recorded (Instruments, Power Profiler, xctrace), or aggregated from users a day
later (MetricKit, Organizer).
Download PDF Print view LaTeX source

Unified logging (iOS 10+; Logger iOS 14)
Logger(subsystem: "com.acme.app", category: "network"): reverse-DNS area + component, both filter keys. Replaced ASL and syslog.- Stored binary + compressed, formatted only when read; a discarded
debugis near-free (the compiler skips building its message).print= stdout, “for command-line UI”: no level, metadata or redaction.
| level | persisted (Apple’s table) | alias | shown |
|---|---|---|---|
debug | no — memory only | trace | |
info | only if collected with log | ||
notice | yes, to a storage limit (default) | log | |
error | yes + the activity’s process chain | warning | yellow |
fault | same; the slowest level | critical | red |
- Privacy (
.auto): ints, floats, bools shown; dynamic strings and objects redacted..publicshows;.private=.sensitiveredact;mask: .hashprints a per-process hash instead, so equal values correlate. - Xcode 15+ console: metadata under each line, tokenised filters, Space = Quick Look, jump to the source line. Console.app: Action > Include
Info / Debug Messages — live stream only; a
.logarchivealready has them. - Field:
try OSLogStore(scope:.currentProcessIdentifier)(iOS 15) reads your own entries back for a report; or a sysdiagnose.
Example
import os
extension Logger {
  static let net = Logger(subsystem: "com.acme.app",
                          category: "network") }
Logger.net.info("GET \(url.path, privacy: .public)")
Logger.net.error("HTTP \(code) user \(uid,
                 privacy: .private(mask: .hash))")
let sp = OSSignposter(logger: .net)
func fetch() async throws -> Feed {
  let st = sp.beginInterval("Fetch", id: sp.makeSignpostID())
  defer { sp.endInterval("Fetch", st) }  // same StaticString name
  sp.emitEvent("CacheMiss")               // a point, not a span
  return try await api.feed()
}
log stream --level debug --predicate 'subsystem == "com.acme.app"'
log collect --device --start 2026-10-07 --output bug.logarchive
xcrun xctrace record --template 'Time Profiler' --time-limit 30s \
--window 5s --no-prompt --output feed.trace --launch -- MyApp.appSignposts — time, not words
- Interval: begin/end with the same static name. The returned
OSSignpostIntervalStateenforces one end per begin, same name, same log — a violation crashes Debug builds; Release attaches an error to the end. - ID
.exclusive(default) if only one such interval runs at a time, elsemakeSignpostID(). Event =emitEvent, an instant. .pointsOfInterestcategory → Points of Interest, auto-included with Time Profiler.OSSignposter.disabled≈ no-op; gate costly metadata onisEnabled.- Xcode 27: a track per signpost name under its category; os_log overlaid on Time/CPU Profiler thread tracks; StateReporting states in Points of Interest.
- CI:
XCTOSSignpostMetric(subsystem:category:name:)inmeasure(metrics:)— no result without a begin/end pair.xctrace:--run-name(26);--recording-options,exportstraight from.atrc/.logarchivewith--time-start/--time-end/--duration(27).
Power Profiler (Xcode 26; iOS / iPadOS 26)
- Blank template + Power Profiler. System track: % of battery per hour, charger, thermal state, brightness, SoC sleep. App lanes: power impact of CPU · GPU · display · networking — a score; fix the highest first. All Processes = system only; app lanes need Launch or Attach.
- No Mac: Settings > Developer > Performance Trace → Power Profiler mode → tick the app → Control Center control; up to 10 h; share the
.aar→.atrc→ Instruments (+ a lower-rate Time Profiler). Testers too.
One subsystem — metric — fix
| lane | MetricKit (iOS 27) | fix (Apple’s guidance) |
|---|---|---|
| CPU | CPUTime, CPUInstructionsCount | events, not polling; lowest QoS that fits; 10–100 ms operations |
| GPU | GPUTime | redraw less (Flash Updated Regions); solid backgrounds over blur |
| display | PixelLuminance (APL 0–100, OLED) | brighter pixels cost more: Dark Mode; stop finished animations |
| network | TotalWiFi…, TotalCellular… up/down | one URLSession; batch + compress; isDiscretionary (waits for charging or Wi-Fi) |
| location (no lane) | LocationActivityTime | low desiredAccuracy, distanceFilter; stop when stationary |
Field — MetricKit & Organizer
- iOS 27
MetricManager(MX…deprecated in 27.2):logHandle(category:)+mxSignpost→ dailySignpostIntervalMetric(count, duration histogram,cpuTime,logicalWrites,averageMemory— the last three only frommxSignpost, notOSSignposter). Custom signposts are capped — critical paths only. Diagnostics list the signposts active around the event. Test: Debug > MetricKit > Simulate MetricKit Payloads.
let mk = MetricManager()                  // iOS 27: keep ONE
let h = MetricManager.logHandle(category: "Feed")
mxSignpost(.begin, log: h, name: "Load")  // ... work ...
mxSignpost(.end, log: h, name: "Load")
Task { for await r in mk.metricReports {  // daily, never throws
  for case .signpostInterval(let m)
in r.intervalEntries.fullDayEntry.values { upload(m) } } }- Organizer (anonymised, consenting users, needs volume). Battery Usage: on-screen % per 24 h off power, + background, by Audio · Networking · Processing · Display · Bluetooth · Location · Camera · Torch · NFC. Energy: exception reports with a sample stack + 14-day trend.
- Xcode 27: Insights Overview, Hitches (all animations, was Scrolling), Storage; goals per metric; Generate Recommendations.
Traps
- Support asks for logs and there is nothing:
debug/infoweren’t persisted — log what support needs atnotice+. privacy: .publicon a token or email — a PII leak;.hashcorrelates instead.- Power profiled on a charger (cable or MagSafe) reads 0 — pair wirelessly. Impact scores from two device models don’t compare.
- Thousands of signposts/s recorded immediately skip OS buffering — use
--window.