
react-native · folio
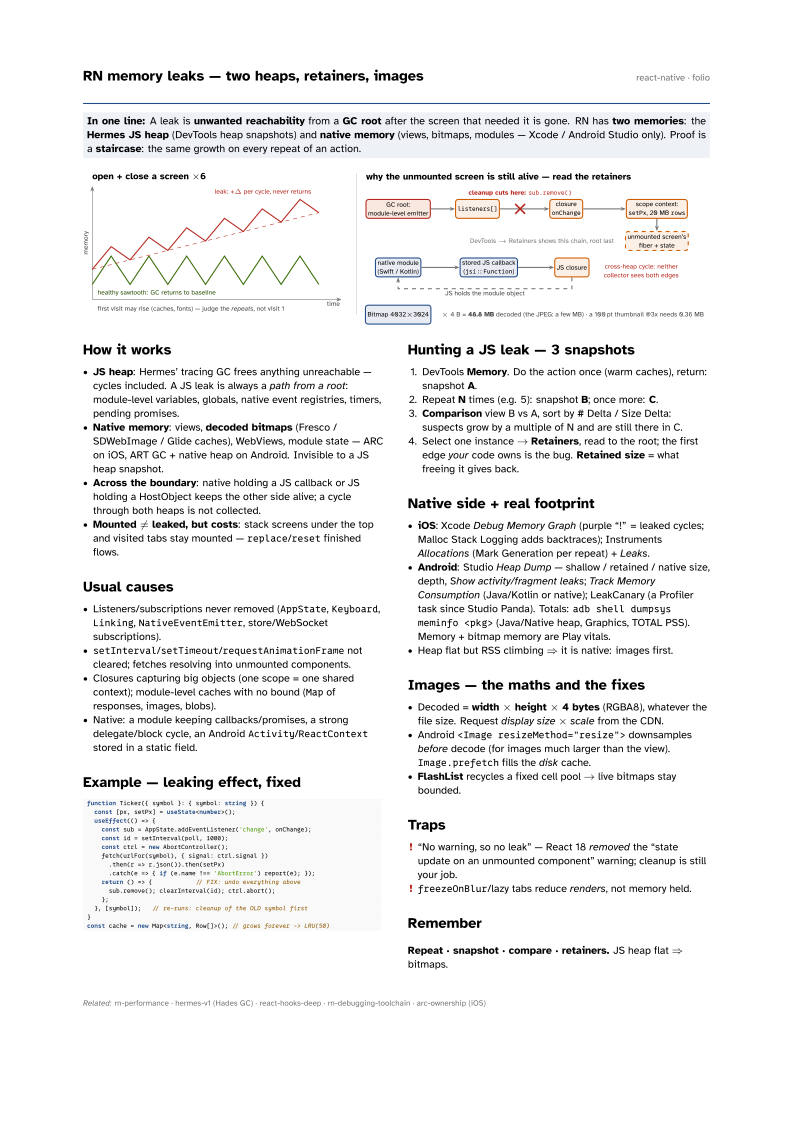
In one line: A leak is unwanted reachability from a GC root after the screen that needed it is gone. RN has two memories: the Hermes JS heap (DevTools heap snapshots) and native memory (views, bitmaps, modules — Xcode / Android Studio only). Proof is a staircase: the same growth on every repeat of an action.
Download PDF Print view LaTeX source

How it works
- JS heap: Hermes’ tracing GC frees anything unreachable — cycles included. A JS leak is always a path from a root: module-level variables, globals, native event registries, timers, pending promises.
- Native memory: views, decoded bitmaps (Fresco / SDWebImage / Glide caches), WebViews, module state — ARC on iOS, ART GC + native heap on Android. Invisible to a JS heap snapshot.
- Across the boundary: native holding a JS callback or JS holding a HostObject keeps the other side alive; a cycle through both heaps is not collected.
- Mounted ≠ leaked, but costs: stack screens under the top and visited tabs stay mounted —
replace/resetfinished flows.
Usual causes
- Listeners/subscriptions never removed (
AppState,Keyboard,Linking,NativeEventEmitter, store/WebSocket subscriptions). setInterval/setTimeout/requestAnimationFramenot cleared; fetches resolving into unmounted components.- Closures capturing big objects (one scope = one shared context); module-level caches with no bound (
Mapof responses, images, blobs). - Native: a module keeping callbacks/promises, a strong delegate/block cycle, an Android
Activity/ReactContextstored in a static field.
Example — leaking effect, fixed
function Ticker({ symbol }: { symbol: string }) {
  const [px, setPx] = useState<number>();
  useEffect(() => {
    const sub = AppState.addEventListener('change', onChange);
    const id = setInterval(poll, 1000);
    const ctrl = new AbortController();
    fetch(urlFor(symbol), { signal: ctrl.signal })
      .then(r => r.json()).then(setPx)
      .catch(e => { if (e.name !== 'AbortError') report(e); });
    return () => {            // FIX: undo everything above
      sub.remove(); clearInterval(id); ctrl.abort();
    };
  }, [symbol]);   // re-runs: cleanup of the OLD symbol first
}
const cache = new Map<string, Row[]>(); // grows forever -> LRU(50)
Hunting a JS leak — 3 snapshots
- DevTools Memory. Do the action once (warm caches), return: snapshot A.
- Repeat N times (e.g. 5): snapshot B; once more: C.
- Comparison view B vs A, sort by # Delta / Size Delta: suspects grow by a multiple of N and are still there in C.
- Select one instance → Retainers, read to the root; the first edge your code owns is the bug. Retained size = what freeing it gives back.
Native side + real footprint
- iOS: Xcode Debug Memory Graph (purple “!” = leaked cycles; Malloc Stack Logging adds backtraces); Instruments Allocations (Mark Generation per repeat) + Leaks.
- Android: Studio Heap Dump — shallow / retained / native size, depth, Show activity/fragment leaks; Track Memory Consumption (Java/Kotlin or native); LeakCanary (a Profiler task since Studio Panda). Totals:
adb shell dumpsys meminfo <pkg>(Java/Native heap, Graphics, TOTAL PSS). Memory + bitmap memory are Play vitals. - Heap flat but RSS climbing ⇒ it is native: images first.
Images — the maths and the fixes
- Decoded = width × height × 4 bytes (RGBA8), whatever the file size. Request display size × scale from the CDN.
- Android
<Image resizeMethod="resize">downsamples before decode (for images much larger than the view).Image.prefetchfills the disk cache. - FlashList recycles a fixed cell pool → live bitmaps stay bounded.
Traps
- “No warning, so no leak” — React 18 removed the “state update on an unmounted component” warning; cleanup is still your job.
freezeOnBlur/lazy tabs reduce renders, not memory held.
Remember
Repeat · snapshot · compare · retainers. JS heap flat ⇒ bitmaps.